1X2 Odds Explained: How to Read & Find Value

The odds flash on your screen. Liverpool 1.85, Draw 3.60, Everton 4.20. You understand these numbers represent potential returns, but do you actually know what they’re telling you about probability? About value? About whether that bet is worth placing or just a way to slowly donate money to bookmakers?
Most bettors treat odds as simple multipliers for their stake without understanding the mathematical language embedded in those numbers. They see 1.85 and think “not much profit” or 4.20 and think “longshot” without calculating the actual probability those odds represent or whether the bookmaker’s assessment aligns with reality. That gap between surface-level understanding and deep comprehension costs recreational bettors thousands over their betting lifetime.
Learning to read odds properly transforms betting from guesswork into calculated probability assessment. You stop asking “what do I think will happen” and start asking “what probability do these odds assign to each outcome, and does my analysis suggest those probabilities are accurate?” That shift in thinking separates profitable long-term betting from expensive entertainment.
Apply this knowledge to your wagers using a proven 1×2 betting strategy.
Understanding Implied Probability
Every set of odds contains hidden probability assessments. The bookmaker isn’t just picking random numbers that feel about right. They’re converting their calculated probability of each outcome into odds format, then adding margin to ensure profit regardless of results.
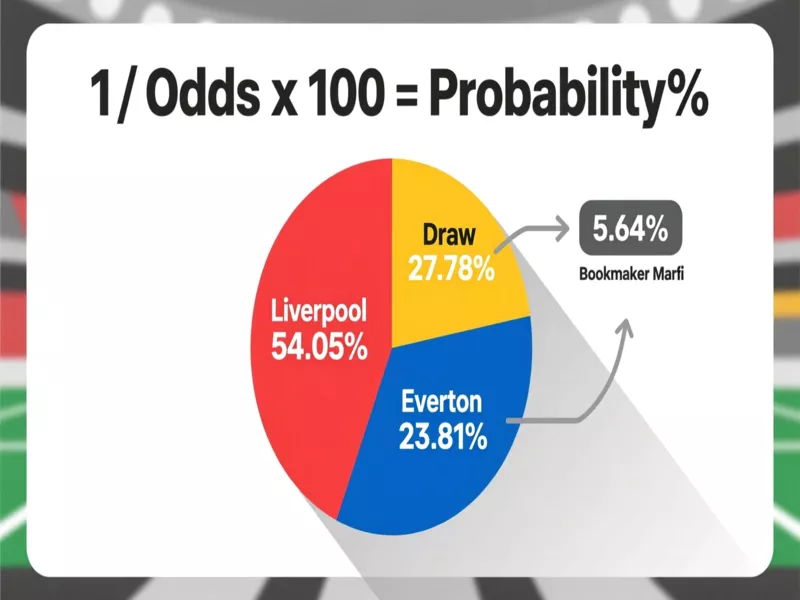
The conversion formula for decimal odds is simple: divide 1 by the decimal odds, multiply by 100 for percentage. Those Liverpool odds of 1.85 convert to 1/1.85 = 0.5405, or 54.05% probability. The draw at 3.60 becomes 27.78% probability. Everton at 4.20 equals 23.81% probability.
Add those three probabilities together and you get 105.64%. Wait, that doesn’t work. Probabilities must total 100% for a complete set of mutually exclusive outcomes. That extra 5.64% represents the bookmaker’s margin, their built-in profit edge distributed across all three possible results.
This overround exists in every betting market. The bookmaker slightly deflates the odds for each outcome compared to the true probability, ensuring they profit long-term regardless of which result occurs. Sharp bookmakers operating in competitive markets keep margins tight at 3-5%. Recreational books serving casual bettors push margins to 8-12% because their customers don’t comparison shop or calculate implied probabilities.
Understanding this mathematical structure immediately clarifies why most bettors lose. You’re not just fighting the difficulty of predicting outcomes correctly. You’re also fighting a 5-10% disadvantage baked into every single bet through the margin. Your analysis must be good enough to overcome that structural edge before you start making profit.
The practical implication: you can’t just pick outcomes you think will happen. You must identify situations where your calculated probability significantly exceeds the implied probability from the odds. That difference represents your edge. Without it, you’re playing a negative expectation game guaranteed to lose money over sufficient volume.
Calculating Fair Odds and Value
Once you understand implied probability, you can work backwards to calculate what odds should be without bookmaker margin. These “fair odds” represent the true mathematical price for each outcome.
Take that Liverpool versus Everton example. The bookmaker’s odds implied 54.05% Liverpool, 27.78% draw, 23.81% Everton, totaling 105.64%. To remove the margin, divide each probability by 1.0564. Liverpool’s fair probability becomes 51.17%, the draw 26.29%, Everton 22.54%. Convert those back to odds: Liverpool 1.954, Draw 3.804, Everton 4.438.
Those fair odds tell you what each outcome should pay without the bookmaker taking their cut. Compare the actual offered odds to fair odds and you immediately see where the margin hits hardest. Liverpool offered at 1.85 versus fair 1.954 represents substantial margin compression. Everton at 4.20 versus fair 4.438 shows lighter margin taxation.
This pattern holds across most markets: bookmakers load more margin onto favorites because that’s where public money flows. The casual bettor backing Liverpool at 1.85 doesn’t realize they’re getting substantially worse value than the longshot bettor backing Everton at 4.20 relative to fair pricing. Smart bettors exploit this by focusing action on underdogs and draws where bookmaker margins thin out.
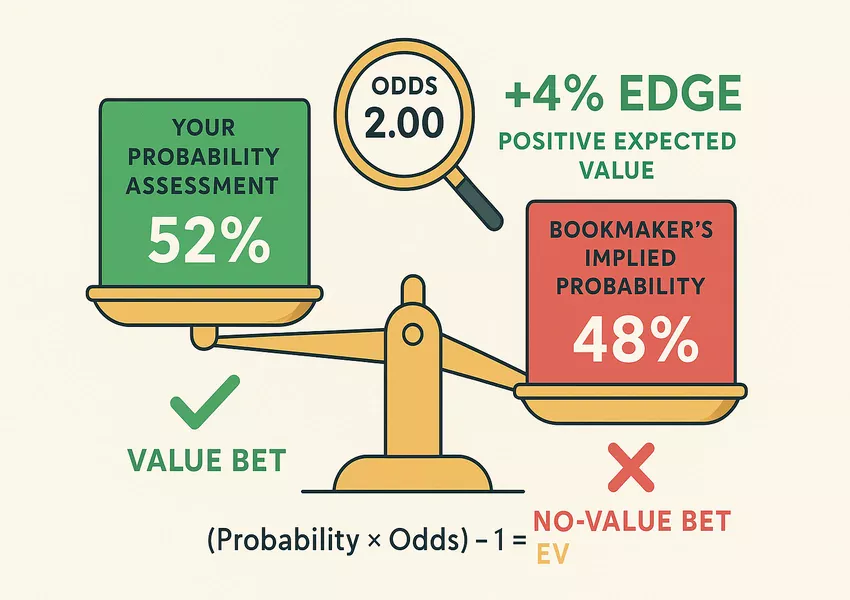
Value betting requires comparing your own probability assessment to the bookmaker’s implied probability. Say your analysis of Liverpool versus Everton suggests Liverpool wins 48% of the time, draw 28%, Everton 24%. Compare to the bookmaker’s implied probabilities of 54.05%, 27.78%, and 23.81%.
Your assessment shows value in the draw at 28% versus implied 27.78%, and massive value in Everton at 24% versus implied 23.81%. No value exists backing Liverpool because your 48% assessment falls well below the bookmaker’s 54.05% implied probability. The market overrates Liverpool’s chances, creating value in the other outcomes.
The critical insight: value has nothing to do with whether Liverpool actually wins this specific match. They might. The bet could lose. But if you consistently identify situations where your probability assessment exceeds market pricing by significant margins, you profit long-term through the mathematical edge. Focusing on individual results instead of process guarantees you’ll never validate whether your approach works.
Reading Different Odds Formats
Bookmakers present odds in various formats depending on regional preferences. Understanding all formats prevents confusion and enables shopping across different bookmakers globally.
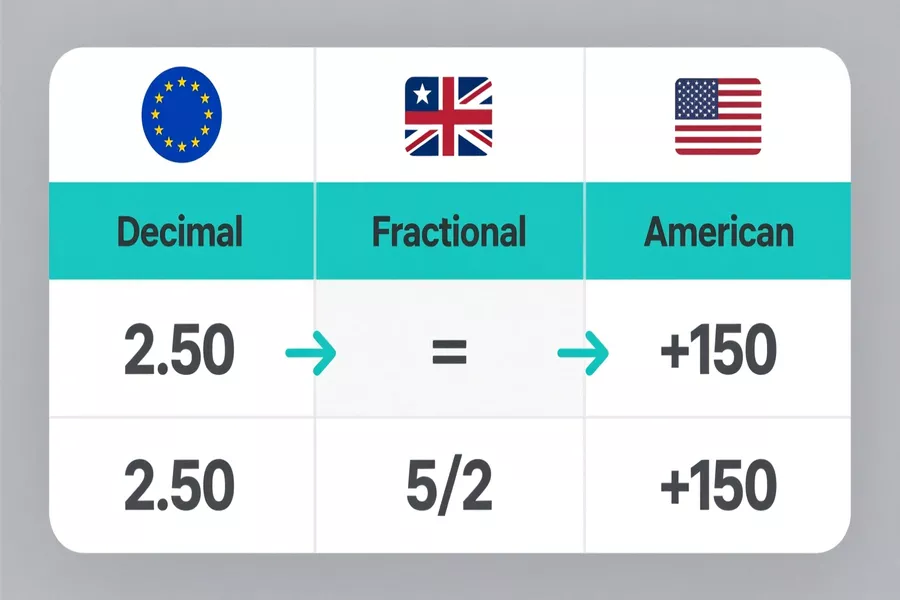
Decimal odds dominate Europe, Australia, and most online bookmakers. The format shows your total return including stake. Odds of 2.50 means betting $100 returns $250 total, which includes your original $100 stake back plus $150 profit. The calculation is simple: stake × decimal odds = total return.
Fractional odds remain popular in the UK and Ireland. These show profit relative to stake. Odds of 5/2 means you profit $5 for every $2 wagered. Bet $100 at 5/2, you get back your $100 stake plus $250 profit for $350 total return. The calculation: (stake × numerator / denominator) + stake = total return.
Converting between decimal and fractional: divide the fraction then add 1. So 5/2 becomes (5/2) + 1 = 3.50 in decimal odds. Going backwards, subtract 1 from decimal odds then express as fraction. Decimal 3.50 becomes 2.50, or 5/2 when simplified.
American odds use positive and negative numbers representing different relationships to $100 stakes. Negative numbers show how much you must stake to profit $100. Odds of -150 means stake $150 to profit $100, total return $250. Positive numbers show how much you profit from $100 stake. Odds of +200 means stake $100 to profit $200, total return $300.
Converting American to decimal: for negative odds, divide 100 by the absolute value then add 1. So -150 becomes (100/150) + 1 = 1.667. For positive odds, divide the number by 100 then add 1. So +200 becomes (200/100) + 1 = 3.00.
The format doesn’t matter once you understand the underlying mathematics. All formats communicate the same information about probability and potential returns. Choose whichever format feels most intuitive for your mental math, but learn to recognize all formats to avoid confusion when using different bookmakers or reading betting analysis from various sources.
How Bookmakers Set Opening Odds
Understanding how bookmakers price markets reveals where inefficiencies exist and when to place bets for maximum value.
Major bookmakers employ trading teams who build statistical models incorporating team strength ratings, recent form metrics, home advantage factors, head-to-head history, injuries, tactical matchups, and hundreds of other variables. These models generate probability estimates for each outcome, which the bookmaker converts to odds while adding their margin.
For high-profile matches like Premier League fixtures, multiple traders independently calculate probabilities then compare results. The final opening odds represent consensus probability adjusted for risk management. These opening lines typically prove quite efficient because substantial resources went into creating them.
Lower-profile matches receive less attention. A random Romanian second division fixture might get basic modeling with standard inputs but no detailed tactical analysis or manual adjustments. These opening odds carry more inefficiency because the bookmaker can’t justify spending significant resources on markets generating minimal betting volume.
Sharp bettors target opening odds in lower-profile matches because that’s where bookmaker efficiency declines. The opening price represents the bookmaker’s best guess with limited information and analysis. If your research uncovers factors the bookmaker’s model missed or underweighted, you can capture value before the market corrects.
Opening odds also reflect balanced book principles. Bookmakers prefer roughly equal money on all outcomes to guarantee profit through the margin regardless of result. But they can’t always achieve perfect balance, especially early. If they expect heavy public money on one side, they shade the opening odds to discourage that action. This shading creates value in the less popular outcomes.
Weather forecasts, team news, and lineup information sometimes emerge after opening odds post. Quick bettors who identify material new information can bet before bookmakers adjust. A late injury to a key player, unexpected starting lineup leak, or forecast change from dry to heavy rain all impact probabilities. The gap between information release and odds adjustment represents a window for value capture.
The critical takeaway: opening odds in major markets are quite efficient but not perfect. Opening odds in minor markets contain more inefficiency. Betting early captures the best prices before sharp money moves lines, but only if your analysis identifies genuine edges rather than imaginary ones.
Odds Movement and What It Signals
Odds change constantly based on betting patterns, new information, and bookmaker risk management. Reading these movements provides insights into market sentiment and where smart money flows.
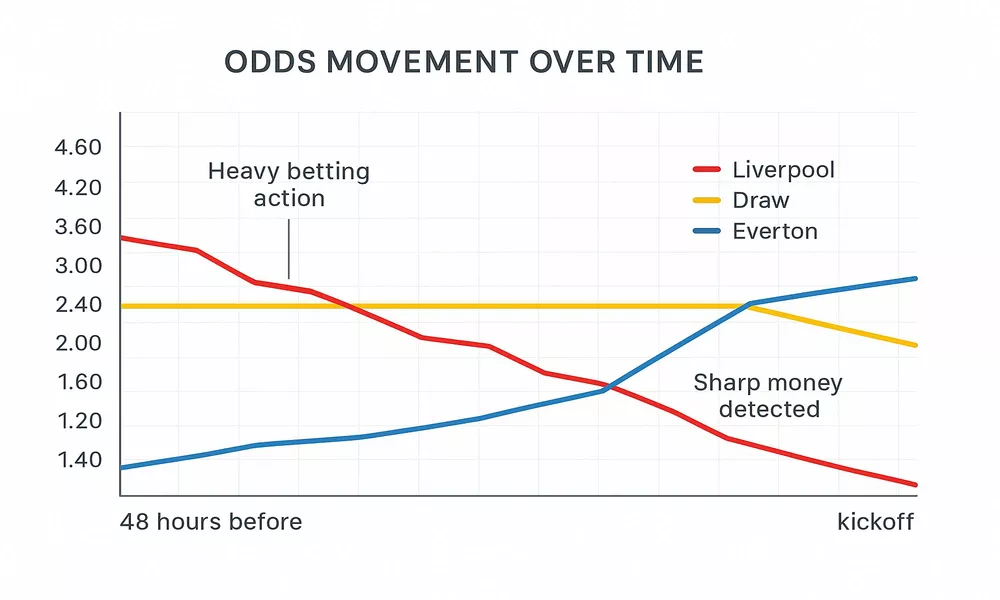
Heavy betting action on one outcome forces bookmakers to lower those odds and raise the opposite outcomes. The bookmaker wants balanced action across all results to guarantee profit. When money piles onto Liverpool, their odds shorten from 1.85 to 1.70 while draw and Everton odds lengthen. This movement signals strong public belief in Liverpool winning, though whether that belief is correct remains separate question.
The size and speed of movement matters more than direction alone. Gradual drifting from 1.85 to 1.80 over 48 hours indicates steady public money but nothing dramatic. Sharp dropping from 1.85 to 1.70 within two hours suggests either very heavy betting volume or smart money hitting the market hard. Bookmakers respect certain bettors and syndicates enough to move lines aggressively when they bet, treating their action as information about true probability.
Steam moves occur when multiple bookmakers cut odds simultaneously within minutes. This coordinated movement indicates sharp betting syndicates hitting markets across multiple books at once. They’ve identified perceived value and are betting heavily before the market fully corrects. Following steam moves offers potential value, though you’re getting worse odds than the smart money captured. The value might still exist if the move hasn’t fully corrected the mispricing.
Reverse line movement happens when odds move opposite to betting percentages. Say 75% of bets back Liverpool but their odds lengthen from 1.85 to 1.95. The public hammers Liverpool while the odds suggest they should be less likely to win. This typically means sharp money is heavily backing the opposite side, and the bookmaker trusts that smart money more than the high volume of recreational action.
Late odds movements immediately before kickoff often reflect late breaking news. Lineup news, injury updates, weather changes, all can shift odds in the final hours or minutes before matches. These movements represent information incorporation rather than betting pattern responses. Sharp bettors monitoring team news feeds can sometimes bet before odds adjust to significant late information.
The discipline required for reading odds movement: don’t blindly follow steam or chase falling odds without understanding why movement occurred. Verify the underlying reason makes sense analytically. Sometimes odds move because public perception is wrong and smart money identified it. Other times odds move because actual material information changed probabilities legitimately. Distinguishing between these scenarios separates smart line reading from momentum chasing.
Finding Value Through Odds Comparison
Different bookmakers price the same markets differently. These pricing discrepancies create immediate, risk-free opportunities to capture better value simply by shopping around.
Premier League match odds might show Liverpool 1.85 at one bookmaker, 1.90 at another, and 1.93 at a third. The difference between 1.85 and 1.93 represents 4.3% better return on the same outcome. Over 100 bets, that’s 4.3 extra units of profit purely from clicking a different website. The time cost of checking three sites takes perhaps 30 seconds per bet. The return on that time investment reaches thousands of percent annually for serious bettors.
Odds comparison sites aggregate prices across dozens of bookmakers, displaying the best available odds for each outcome. These tools eliminate the tedious process of manually checking multiple bookmakers while ensuring you never miss significantly better prices available elsewhere. Using comparison sites becomes mandatory for any bettor serious about long-term profitability.
The pattern of where best odds appear reveals bookmaker positioning strategies. Sharp books serving professional bettors offer the best odds consistently because they operate on minimal margins. Recreational books targeting casual bettors offer worse odds overall but occasionally have best price on specific outcomes due to different risk management approaches or errors.
Having accounts at 5-10 different bookmakers enables consistent value capture. You’re not loyal to one bookmaker like picking a favorite sports team. You’re shopping a market for the best available price on each individual bet. This requires maintaining balances across multiple books and remembering login credentials, but the profit improvement justifies the administrative hassle.
Arbitrage opportunities occasionally appear when different bookmakers price markets so differently that you can bet all outcomes across multiple books and guarantee profit regardless of result. Say Bookmaker A offers Liverpool 2.10, Draw 3.80, Everton 5.00. Bookmaker B offers Liverpool 1.75, Draw 3.50, Everton 7.00. The Everton price at Bookmaker B combined with Liverpool and Draw prices at Bookmaker A might create arbitrage depending on exact calculations.
True arbitrage opportunities exist briefly before bookmakers correct prices. Sharp bettors and automated systems identify and exploit these inefficiencies within minutes. Casual bettors rarely find genuine arbitrage, but the principle demonstrates why odds shopping matters. Even without perfect arbitrage, consistently getting 3-5% better odds than the average available price compounds dramatically over thousands of bets.
Advanced Odds Analysis Techniques
Sophisticated bettors employ statistical and mathematical frameworks beyond basic implied probability calculations to identify value more reliably.
The Pinnacle method uses the sharpest bookmaker’s closing odds as proxy for true probability. Pinnacle operates on minimal margin and attracts huge sharp money volume, making their closing lines highly efficient. Other bookmakers offering worse odds than Pinnacle at close suggest negative value. Better odds than Pinnacle suggests positive value relative to the most efficient market price.
This technique works because Pinnacle allows winners and doesn’t ban sharp bettors, unlike recreational books. The lack of restrictions means maximum sharp money flow, creating market efficiency through competition. If you consistently bet outcomes priced better at your bookmaker than at Pinnacle close, you’ve likely identified systematic value source.
Regression modeling using historical odds and results tests whether specific bookmakers consistently misprice certain patterns. Maybe one bookmaker always underprices draws in low-scoring matches. Another might overprice favorites in derby matches. Building databases tracking odds and results across thousands of matches reveals these bookmaker-specific biases exploitable for value.
The closing line value metric measures how your odds compare to closing odds across the market. If you bet Liverpool at 2.10 and the market closes at 1.85, you captured significant closing line value. If you bet at 1.85 and market closes at 2.10, you got terrible price. Tracking closing line value over hundreds of bets indicates whether you’re beating the market regardless of whether individual bets win or lose. Consistent positive closing line value predicts long-term profitability even through losing stretches.
Expected value calculations incorporate both probability and odds to determine mathematical expectation for each bet. The formula: (Your assessed probability × Decimal odds) – 1. Positive results indicate value bets worth placing. Negative results indicate bets to avoid. Say you assess Liverpool at 52% probability with odds of 2.10. The calculation: (0.52 × 2.10) – 1 = 0.092, or 9.2% expected value. That’s significant edge worth betting.
Correlation analysis between different outcomes within matches and across related matches helps assess parlay and accumulator value accurately. Many bettors incorrectly assume bet independence when correlation exists, leading to overestimating accumulator value. Understanding correlation patterns enables better decision-making about when combining bets makes sense versus when it destroys value.
Odds Betting Common Pitfalls
Even experienced bettors make systematic mistakes when analyzing odds and assessing value.
Anchoring to opening odds prevents adjusting to new information properly. You see opening odds of Liverpool 2.00 and decide that’s worth betting. The odds move to 1.75 after team news emerges. You bet anyway because you anchored mentally to that 2.00 figure without recognizing the new information eliminated your edge. Odds change for reasons. Reassess value after material movements rather than stubbornly pursuing original targets.
Misunderstanding favorite-longshot bias leads to terrible betting patterns. Recreational bettors overbet favorites and underbet longshots systematically. This public bias causes bookmakers to shade favorite odds lower and longshot odds higher than true probability. The market pattern: favorites offer worse value than odds suggest, longshots offer better value. Blindly backing favorites at short odds guarantees long-term losses.
Ignoring different margins across bookmakers and bet types costs money invisibly. You might get 5% margin on Premier League match winner but 12% margin on first goalscorer in the same match. The second bet requires substantially more edge to overcome the higher margin. Always calculate implied probability totals to understand margin size before assessing whether apparent value is real or illusion.
Chasing big odds without proper probability assessment destroys bankrolls through exciting losses. Those 15.00 odds on an upset look tempting with potential massive return. But do they represent value? Calculate implied probability (6.67%) and honestly assess whether your analysis supports even 8-9% probability. Usually it doesn’t. The tempting big odds reflect accurate low probability rather than mispricing.
Betting odds shorter than 1.50 requires unrealistic accuracy to profit long-term. Odds of 1.30 need 77% win rate to break even. Add bookmaker margin and you need 80%+ accuracy. Nobody maintains 80% accuracy across sufficient sample sizes. Those “safe” short odds lose money systematically despite winning frequently because the few losses wipe out many winning bets.
Results-oriented thinking evaluates odds quality based on whether bets won rather than whether the process was sound. You bet an underdog at 4.50 based on solid value identification. They lose 3-0. That doesn’t mean the odds analysis was wrong or the bet was bad. If the same situation arose 100 times, that bet makes money over the sample. Single results mean nothing. Process quality and long-term expected value determine success.
Building Odds-Based Betting Systems
Systematic approaches to odds analysis remove emotion and ensure consistent value identification across hundreds of bets.
Create an odds tracking spreadsheet recording every bet with date, match, selection, opening odds, your bet odds, closing odds, result, and profit/loss. After 200+ bets, analyze your results segmented by odds ranges. Many bettors discover they profit betting odds of 2.50-4.00 while losing money on favorites under 2.00 and longshots over 5.00. This information tells you exactly where your edge exists and where to focus future action.
Develop minimum value thresholds before placing bets. Perhaps you require 5% positive expected value minimum to justify action. Calculate expected value for every potential bet, only placing those exceeding your threshold. This discipline prevents marginal bets where small theoretical edge doesn’t justify the action given variance and uncertainty in probability assessment.
Build bookmaker-specific profiles tracking their odds competitiveness across different leagues and bet types. You might find Bookmaker A consistently offers best odds on Premier League underdogs while Bookmaker B excels at La Liga favorites. Understanding these patterns streamlines odds shopping by directing you to the most likely value sources for each specific bet type.
Implement closing line value tracking for every bet regardless of result. Your long-term profitability correlates strongly with whether you consistently beat closing odds. If you’re getting worse odds than close across most bets, you’re betting too late or targeting the wrong outcomes. Positive closing line value over large samples predicts profitability even when current results show losses due to variance.
Create automated alerts for odds reaching specific thresholds you’ve identified as valuable. If your analysis suggests Liverpool should be 2.20 or higher to offer value, set alerts triggering when odds hit that target. This automation ensures you never miss value opportunities while avoiding constant manual monitoring causing decision fatigue.
The goal of systematic odds-based betting: remove emotions, guesswork, and cognitive biases from the process. The numbers tell you objectively where value exists. Your job involves setting up systems that identify those value spots reliably then executing with discipline regardless of short-term results. Trust the mathematics and sample sizes, not feelings and recent outcomes.
Check current market lines on our main platform.
Expertly verified: Amelia Foster