
1X2 Betting Strategy: Proven Methods
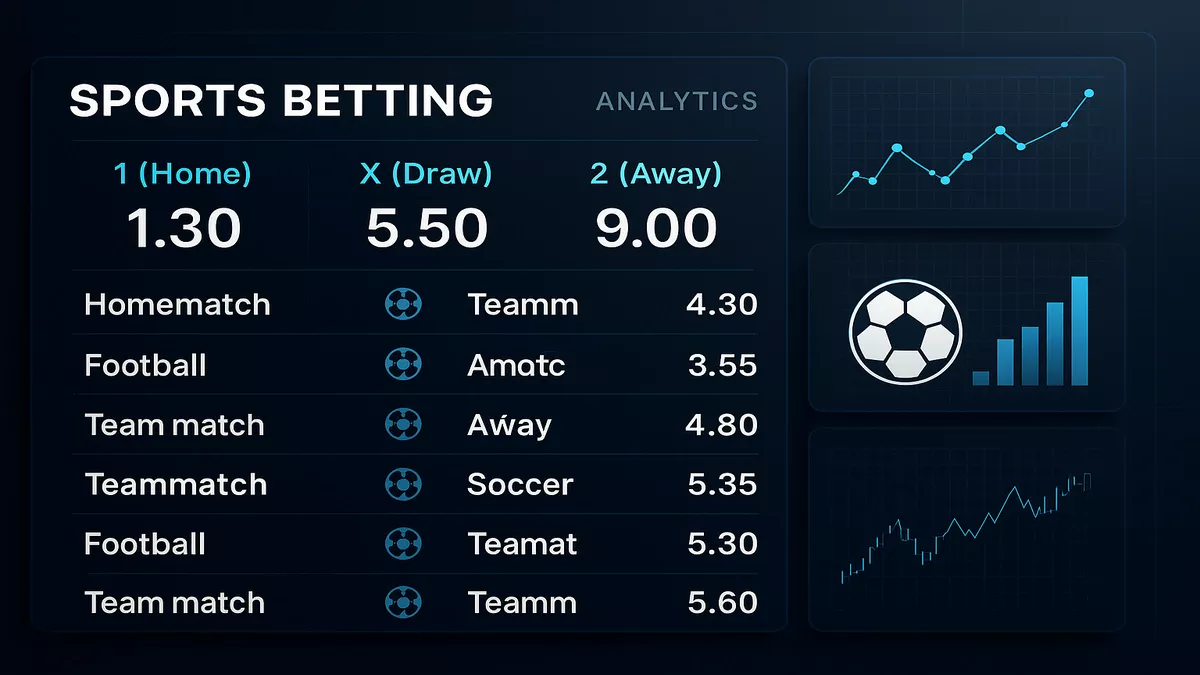
You’ve placed enough 1X2 bets to know the basics. Home win, draw, away win. Simple stuff. But your bankroll tells a different story. Some weeks you’re up, most weeks you’re scratching your head wondering where the edge disappeared to. The problem isn’t understanding what 1X2 betting is. The problem is not having a systematic approach to finding value and managing risk.
Here’s what separates profitable bettors from everyone else: they treat 1X2 betting like a business, not a hobby. They don’t back teams because they like them or because the odds look decent. They identify specific market inefficiencies, exploit them consistently, and manage their money with cold precision. This guide breaks down the exact strategies that work, the analytical frameworks that reveal value, and the bankroll management systems that protect you from inevitable variance.
No motivational nonsense about trusting your gut. No generic tips about doing research. Just the practical, proven strategies that turn 1X2 betting from random guessing into calculated edge-seeking.
Compare this method with a more conservative approach in our 1×2 vs double chance guide.
Understanding Value in 1X2 Markets
Most bettors lose money because they fundamentally misunderstand what they’re trying to achieve. They think the goal is picking winners. Wrong. The goal is identifying bets where the odds overestimate the probability of an outcome relative to your own assessment.
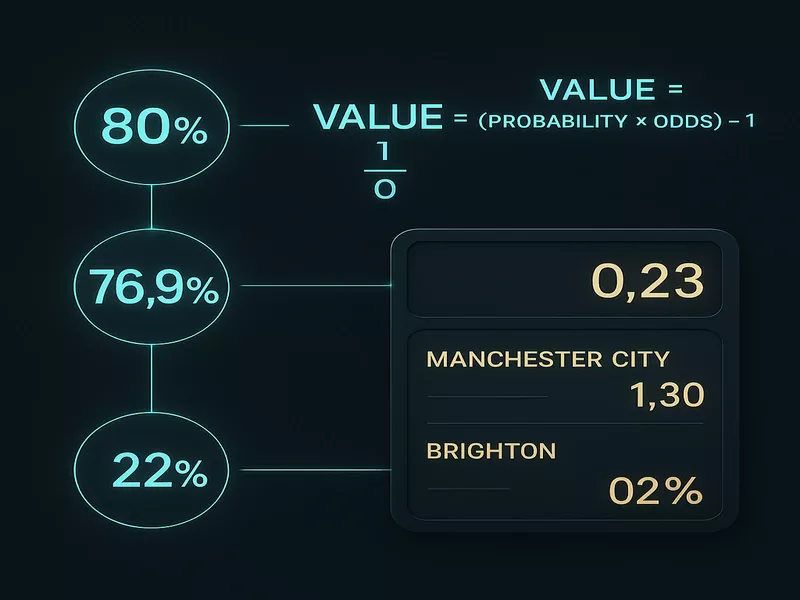
Say Manchester City plays Brighton. The bookmaker offers these odds: City 1.30, Draw 5.50, Brighton 9.00. Your analysis suggests City should win roughly 80% of the time. The 1.30 odds imply 76.9% probability. That gap represents value, but is it enough?
Calculate the expected value using this formula: (Your probability × Decimal odds) – 1. For City at 1.30 with your 80% assessment: (0.80 × 1.30) – 1 = 0.04, or 4% edge. That’s marginal value. Over hundreds of bets, a 4% edge compounds significantly. But variance will hurt before the edge materializes.
Now look at the draw. Bookmaker odds of 5.50 imply 18.2% probability. Your analysis of defensive matches between these teams, City’s rotation for upcoming Champions League fixtures, and Brighton’s organized defensive shape suggests this draw happens closer to 22% of the time. Expected value: (0.22 × 5.50) – 1 = 0.21, or 21% edge. That’s massive value worth backing.
The critical insight: favorites rarely offer value because public money inflates their prices. Draws and underdogs hide value more frequently. Your job involves calculating your own probabilities first, comparing them to implied probabilities from odds, and betting only when significant gaps exist.
Most bettors do this backwards. They see odds first, then rationalize bets to match those odds. That path guarantees long-term losses.
Pre-Match Analysis Framework
Winning 1X2 betting demands systematic analysis before every bet. Random feelings about teams don’t cut it. You need repeatable processes that identify genuine edges.
Start with recent form analysis, but go deeper than simple results. Look at the last eight matches for each team. Don’t just count wins and losses. Watch how they won and lost. A team scraping 1-0 victories while getting dominated in possession and shots tells a very different story than a team winning 3-1 consistently while controlling matches.
Expected goals data reveals which teams overperform or underperform their underlying quality. Liverpool might be winning matches 2-1 but posting xG numbers of 2.8 per match while allowing only 0.6. That’s sustainable dominance. Another team might also win 2-1 regularly but with xG of 1.2 for and 1.8 against. They’re riding luck that will regress.
Home and away splits matter enormously in 1X2 betting because the home advantage impacts all three outcomes differently. Some teams transform at home, converting 60% of home matches into wins while winning only 25% away. Others show minimal home advantage. Track these splits over at least 20 matches to establish reliable patterns.
Head-to-head records between specific opponents reveal tactical matchups that transcend current form. Certain teams consistently struggle against particular opponents due to stylistic clashes. Liverpool dominated Manchester United for years regardless of their respective league positions. These patterns persist across multiple seasons because tactical approaches don’t change dramatically.
Motivation factors influence results more than most bettors acknowledge. A relegation-threatened team playing a must-win home match brings different intensity than a mid-table side with nothing to play for. Title contenders facing crucial matches approach games differently than teams already assured of Champions League qualification. Factor these psychological elements into your probability assessments.
Injuries and suspensions impact matches unevenly. Losing your starting goalkeeper or best center back matters more than losing a backup midfielder. Losing a striker who scores 50% of your goals changes everything about your attacking threat. Track team news obsessively in the 48 hours before matches because late injury news moves markets and creates opportunities.
Weather conditions affect certain teams more than others. Heavy rain favors defensive, direct teams over technical sides that rely on intricate passing. Strong wind disrupts aerial play and long passing. Terrible pitch conditions reduce technical quality and increase randomness. These factors tilt probabilities enough to create value when bookmakers don’t fully price them in.
Statistical Models for 1X2 Betting
Pure fundamental analysis takes you far, but statistical models provide objective frameworks that remove bias and emotion from decisions.
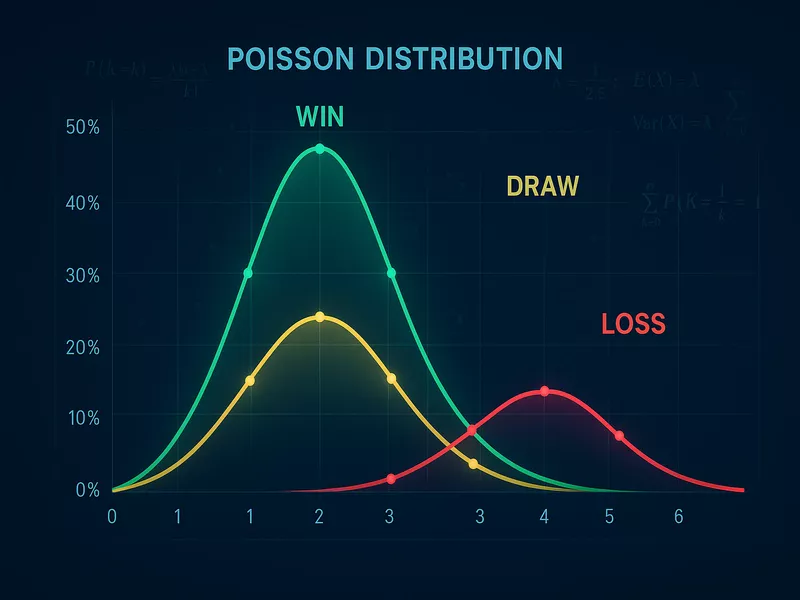
The Poisson distribution model estimates match outcomes based on historical goal-scoring rates. Calculate each team’s average goals scored and conceded, adjust for opponent strength and home advantage, then use Poisson formulas to generate probabilities for different scorelines. Sum the probabilities for outcomes matching each 1X2 result.
Here’s how it works practically. Say Liverpool averages 2.1 goals at home and Newcastle averages 0.9 goals away. The Poisson model calculates probability of Liverpool winning as roughly 68%, draw at 19%, and Newcastle winning at 13%. Compare these to bookmaker odds. If the bookmaker offers 1.35 on Liverpool (implying 74% probability), the draw at 5.00 (20%), and Newcastle at 8.00 (12.5%), you’ve found value in the draw where your model shows 19% probability versus bookmaker’s 20%, but the odds are close to fair. No bet warranted.
The Dixon-Coles model improves on basic Poisson by adjusting for low-scoring match tendencies. Standard Poisson overestimates 0-0, 1-0, 0-1, and 1-1 scorelines. Dixon-Coles adds correction factors based on historical data about how often these scores actually occur versus Poisson predictions. This refinement matters for draw probability calculations specifically.
Regression models using multiple variables provide more sophisticated probability estimates. Build models incorporating team strength ratings, recent form metrics, home advantage factors, head-to-head results, rest days between matches, lineup strength, and motivation factors. Weight each variable based on its predictive power, then generate probability outputs for each match.
The key with statistical models: they complement fundamental analysis, they don’t replace it. Use models to generate baseline probabilities, then adjust for factors models can’t capture like manager changes, squad morale, tactical adjustments, or unique circumstances. The combination of quantitative and qualitative analysis beats either approach alone.
Identifying Draw Value
Draws represent the most misunderstood outcome in 1X2 betting. Most bettors either ignore them completely or back them randomly based on gut feeling. Smart bettors recognize draws as the highest-value outcome when identified correctly.

Draw probability correlates strongly with defensive strength of both teams. Two sides averaging fewer than 1.0 goals conceded per match produce draws far more frequently than average. Look for matches where both teams rank in the top tier defensively but struggle to create chances offensively.
Tactical stalemates create draws predictably. When two defensive managers face each other, especially in high-stakes matches where neither can afford defeat, draws become likely outcomes. Cup semi-finals, relegation battles, local derbies where pride prevents risk-taking, all produce higher draw frequencies than normal league matches.
Matches between mid-table teams with nothing particular to play for generate draws around 32-35% of the time in major leagues. Bookmakers typically price these draws at 3.20-3.40 odds, implying 29-31% probability. That gap represents consistent value if you identify the right fixtures.
Weather conditions dramatically impact draw probability. Heavy rain increases draws by roughly 8-10 percentage points because attacking play becomes more difficult and defensive teams can frustrate opponents more easily. Wind affects passing accuracy, leading to scrappier matches that finish level more often. Track weather forecasts and bet draws when conditions favor defensive football.
Team rotation ahead of important fixtures increases draw likelihood. A team playing Saturday then Wednesday in Champions League often rotates key players for the league match. Weakened attacking options reduce win probability while making draws more likely. Bookmakers adjust for this, but not always sufficiently.
First-half draw betting offers even more value than full-time draws. Opening 45 minutes see cautious play, especially from away sides who prioritize not conceding early. First-half draws happen in roughly 45-50% of matches, yet odds typically sit around 2.10-2.30, implying only 43-48% probability. That slim edge compounds over many bets.
The critical mistake bettors make with draws: they back them based on “these teams always draw” reasoning after seeing two teams drew their last three meetings. Past draws don’t predict future draws without underlying causes. The teams must have specific characteristics that make draws likely, not just coincidental recent results.
Bankroll Management Systems
Brilliant analysis means nothing without disciplined bankroll management. You can pick 55% winners and still go broke if you bet recklessly. Conversely, mediocre handicapping with excellent money management often outperforms better analysis with poor staking.
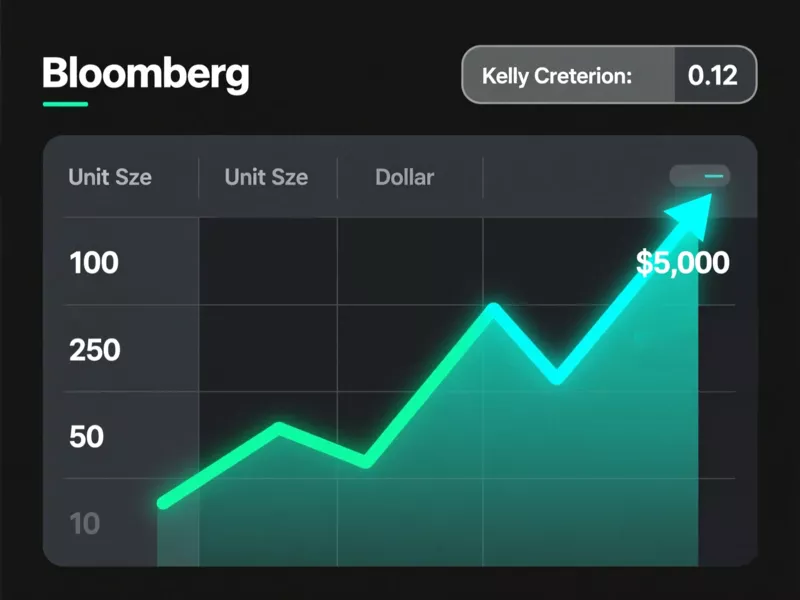
The flat betting system provides the foundation. Define one unit as 1-2% of your total bankroll. Bet one unit on every play regardless of confidence or recent results. This approach removes emotion and ensures no single loss devastates your bankroll.
If you start with $5,000, one unit equals $50-100. Every bet uses this stake whether you love the play or merely like it. Win ten straight, you don’t increase stakes. Lose ten straight, you don’t chase by betting more. Flat betting feels boring but the math works over large sample sizes.
The percentage betting system adjusts stakes as your bankroll grows or shrinks. Recalculate your unit size weekly or monthly based on current bankroll. If you grow to $6,000, your unit increases to $60-120. Drop to $4,000, units decrease to $40-80. This approach lets winners compound while automatically reducing risk after losses.
The Kelly Criterion calculates optimal bet size based on your edge and the odds. The formula: (bp – q) / b, where b equals decimal odds minus 1, p equals your assessed probability of winning, and q equals 1 minus p. Say you assess 45% probability on odds of 2.50. The Kelly calculation suggests betting 8% of your bankroll. That’s aggressive. Most professionals use quarter-Kelly or half-Kelly to reduce variance.
Here’s the practical reality: strict Kelly betting produces optimal long-term growth mathematically but creates massive volatility psychologically. Watching your bankroll swing 30% in either direction weekly destroys most bettors mentally. Fractional Kelly smooths variance while capturing most of the growth benefit.
Whatever system you choose, never bet more than 5% of your bankroll on any single play. That ceiling prevents catastrophic losses from genuine edges that don’t hit short-term due to variance. Even the best 1X2 bets lose 40-50% of the time. Betting too heavily ensures you’ll go broke before your edge materializes statistically.
Track every bet religiously. Record date, teams, selection, odds, stake, result, and profit or loss. After 100 bets, patterns emerge. Maybe you profit backing favorites but lose backing draws. Maybe home teams make you money while away teams drain bankrolls. Maybe certain leagues or bet types consistently show positive returns while others don’t. You can’t optimize what you don’t measure.
Live Betting Strategies for 1X2 Markets
In-play betting opens opportunities unavailable pre-match because odds shift dramatically based on early match events. Smart bettors exploit overreactions and momentum shifts.
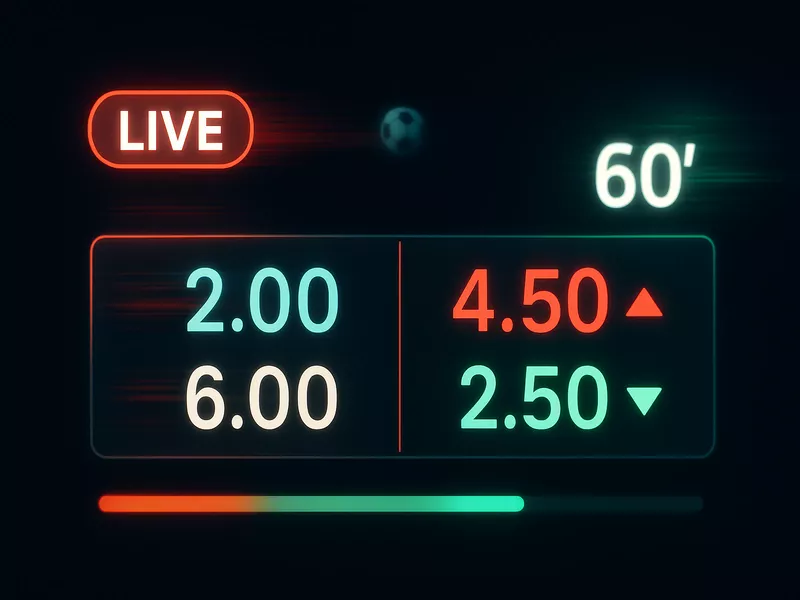
The early goal scenario creates massive value regularly. Home team goes down 1-0 in the 12th minute. Bookmakers immediately blow out their odds from 2.00 pre-match to 4.50 or higher. But has the probability really changed that much? If the underlying match dynamics suggest the home team still controls play and creates chances, that 4.50 represents enormous value. One team scoring early doesn’t mean they’re suddenly the better side.
Statistical analysis shows teams that score first win only about 65-70% of matches. That means 30-35% of matches see the team trailing early either draw or come back to win. When bookmakers offer 4.50 on a trailing home team, they’re implying 22% probability. If your assessment puts it closer to 35%, that’s massive edge worth backing.
The reverse scenario also creates value. Away underdog scores against the run of play in the 8th minute. Their odds to win crash from 6.00 pre-match to 2.50. But the home team was dominating and still looks better. The underdog’s early goal came from a defensive mistake or lucky break, not sustainable superiority. Laying the underdog at 2.50 or backing the home team at inflated odds captures value.
Half-time betting provides a reset point where you’ve watched 45 minutes and understand match dynamics better than pre-match predictions suggested. Some teams consistently dominate first halves then fade. Others start slowly then take over after the break. Identify these patterns across multiple matches, then exploit them live.
Weather deterioration during matches creates opportunities. Match starts in dry conditions, heavy rain begins at half-time. Odds don’t adjust quickly enough for how much the weather shift favors defensive play and increases draw probability. Bet draws when conditions turn poor mid-match.
Substitution patterns reveal tactical intentions. Trailing team brings on three attacking players at 60 minutes, pushing everyone forward desperately. Their odds to win might not shift much, but draw odds should increase because they’re exposed defensively while chasing the game. Backing draws when losing teams commit numbers forward exploits their vulnerability to late counters that equalize.
The critical discipline in live betting: bet your pre-match preparation, not the excitement of watching. It’s easy to place impulsive bets based on short-term momentum swings that don’t reflect true match quality. Stick to situations where your analysis identifies genuine value from overreactions.
Exploiting Bookmaker Weaknesses
Different bookmakers have different strengths and weaknesses. Sharp books serving professional bettors offer tight margins and accurate odds. Recreational books targeting casual punters carry higher margins and slower odds adjustments. Understanding these differences creates opportunities.
Sharp bookmakers like Pinnacle operate on 2-3% margins and move odds quickly based on sharp money. Their odds represent the most efficient market pricing. Use sharp book odds as a baseline for true probability, then compare to recreational books. When you find +EV opportunities at recreational books relative to sharp book pricing, you’ve identified genuine value.
Recreational bookmakers often misprice niche markets more than major leagues. Premier League odds stay sharp because massive betting volume keeps them efficient. Romanian second division matches carry less scrutiny and bigger edges. If you develop expertise in less popular leagues, recreational books provide steady value because they don’t invest resources pricing these markets accurately.
Early odds from recreational books create opportunities before market forces correct them. Sharp bettors hammer inefficient opening lines, forcing bookmakers to adjust. If you identify value in early odds and bet quickly, you capture prices that won’t exist an hour later. This requires preparation and fast execution.
Bookmaker promotions occasionally create positive expectation plays. Offers like “money back as free bet if your team leads then draws” or “odds boost on selected matches” shift the edge toward bettors if used strategically. Calculate whether promotions provide genuine value or just marketing gimmicks that appear valuable but aren’t.
The key insight: treat bookmakers as markets with inefficiencies, not opponents to outsmart. You’re not trying to trick them. You’re identifying prices that don’t reflect true probability due to structural limitations like limited liquidity in niche markets or slow odds adjustments to new information.
Common Strategy Pitfalls
Even experienced bettors fall into patterns that undermine otherwise sound strategies.
Overconfidence after winning streaks leads to loosening standards. You hit eight winners from ten bets, suddenly every match looks profitable. Variance delivered temporary success, not improved skill. Maintain the same analytical rigor whether you’re up or down. Don’t start taking marginal bets because recent results inflated your confidence.
Results-oriented thinking evaluates decisions based on outcomes rather than process. You back an underdog at great odds based on solid analysis. They lose 3-0. That doesn’t mean the bet was wrong. If you’d make the same bet 100 times in identical circumstances, it’s correct regardless of this particular outcome. Judge decisions by expected value, not results.
Anchoring to pre-match odds prevents adjusting to new information. You planned to back Liverpool at 2.20 but they’re now 1.90 after Salah injury news. The value disappeared but you bet anyway because you committed mentally. Odds change for reasons. React to new information rationally instead of stubbornly following original plans.
Revenge betting after frustrating losses compounds mistakes. Your draw bet loses to a 94th minute winner. You immediately back the next available draw to recover losses. That’s emotional gambling, not strategic betting. Each bet must stand on its own analytical merit independent of previous results.
Confirmation bias seeks information supporting pre-existing beliefs while ignoring contradictory evidence. You want to back Chelsea so you focus on their recent wins while dismissing defensive vulnerabilities. Force yourself to steelman the opposing case. If you can’t articulate strong reasons why your bet might lose, you haven’t analyzed properly.
Ignoring league-specific characteristics costs money. Some leagues produce far more draws than others due to tactical culture and competitive balance. Serie A averages 28% draws, Bundesliga only 24%. Your draw betting strategy profitable in Italy might lose in Germany without adjustment. Understand each league’s unique statistical profile.
The path to long-term profitability requires acknowledging these pitfalls then building systems that minimize their impact. Checklists, betting journals, and mandatory waiting periods before placing bets all help maintain discipline when emotions threaten good process.
Building a Sustainable Edge
Short-term success means nothing in 1X2 betting. Variance ensures anyone can win for weeks or months through luck. Sustainable profitability over years requires developing genuine edges and protecting them.
Specialize in specific leagues or bet types where you can develop deep expertise. Trying to bet every league dilutes your attention and prevents accumulating the detailed knowledge that creates edges. Pick 2-3 leagues, study them obsessively, and become expert in those markets.
Track your performance by league, bet type, odds range, and any other relevant category. After 200+ bets, clear patterns emerge about where your edge exists. Maybe you profit on home underdogs but lose backing away favorites. Maybe your draw betting crushes but you’re barely break-even on outright winners. Double down on what works, minimize or eliminate what doesn’t.
Continuously update your models and processes as leagues evolve. Tactical trends change, team quality shifts, and yesterday’s edges disappear. What worked three seasons ago might not work now. Treat strategy development as ongoing refinement, not static system deployment.
Accept that your edge will be small. Crushing 1X2 markets consistently isn’t realistic against efficient bookmaker pricing. Sustainable edges typically range from 3-8% depending on market efficiency. That’s enough to beat the bookmaker margin and generate long-term profits, but it requires patience and large bet volume to realize.
Prepare psychologically for inevitable losing streaks. Even with legitimate 55% win rate, you’ll experience stretches losing 7 of 10 bets purely from variance. Bankroll management protects you financially, but mental fortitude keeps you executing your process when doubt creeps in. Losing streaks don’t invalidate edges that have worked over thousands of bets.
The bettors who last years in this game understand they’re playing a mathematical long game where small edges compound through repetition and discipline. They’re not looking for the next big score. They’re grinding out slight advantages bet after bet, week after week, until variance smooths out and the edge delivers.
Navigate our official homepage for daily updates.
Expertly verified: Amelia Foster